 ScoreSync News
Open App
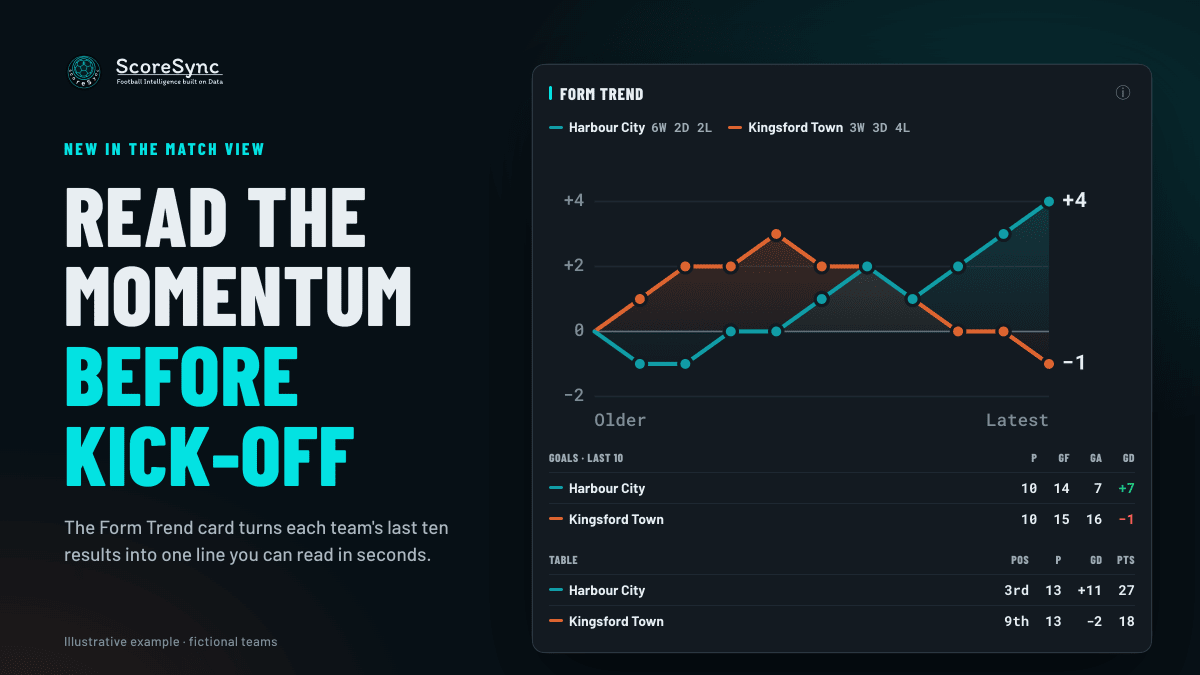
A results list like "W D L W W" tells you what happened. It doesn't show you where a team is heading.
Two teams can both have won three of their last five. One is on a roll. The other is running out of steam. The Form Trend card is built to show you the difference in a few seconds.
What the card shows
For each team, Form Trend takes their last ten results across every competition and draws them as a line. Oldest is on the left, latest on the right.
- A win moves the line up one step.
- A draw keeps it level.
- A loss moves it down one step.
Both teams share one chart, so you can compare them side by side. Tap or hover over any point to see the opponent, the venue and the score of that match.
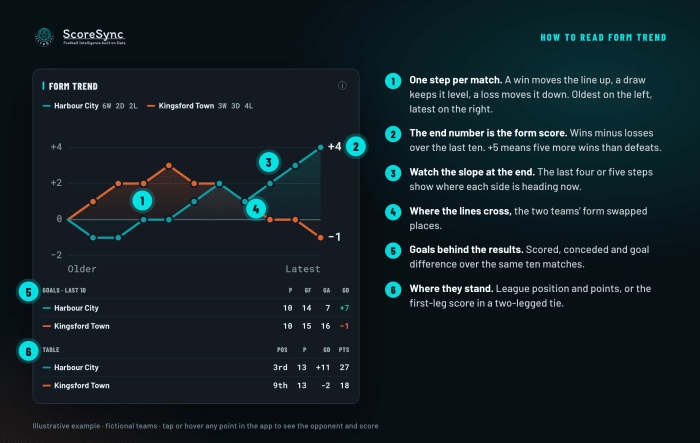
Read it in four steps
1. Start with the end number. The value at the right end of each line is wins minus losses over the last ten. A team on +4 has won four more than it has lost. A team on −1 has lost one more than it has won.
2. Then check the slope at the end. The last four or five steps matter more than the total. Two teams can both finish on +2. One climbed there steadily. The other fell from +5. They are in very different moods.
3. Look for where the lines cross. A crossing is the moment two teams swapped places. If it happened in the last few matches, the side that was ahead earlier is no longer in better shape.
4. Read the goals and table underneath. The card also shows goals scored, goals conceded and goal difference over the same ten matches.
- A winning run with a thin goal difference means narrow wins.
- A big goal difference means the team has been controlling games.
- In league matches you also see table position, games played and points.
- In the second leg of a knockout tie you see the first-leg score and the aggregate.
A quick example
These teams are made up, just to show the idea.
Rovers finish on +3. United finish on +3 too. On the end number alone, they look identical.
Now look at the lines. Rovers lost three of their first five and then won five in a row. United won their first six and have lost three of the last four.
Same number, opposite stories. Rovers are climbing, United are sliding. That is the whole point of the card: the shape tells you what the number can't.
Three shapes to recognise
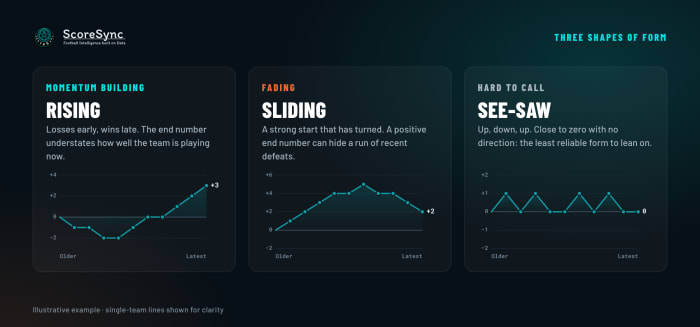
- Rising. Losses early, wins late. The end number understates how well the team is playing now.
- Sliding. A strong start that has turned. A positive end number can hide a run of recent defeats.
- See-saw. Up, down, up, finishing close to zero with no clear direction. This is the least reliable form to lean on either way.
Your 30-second routine
Short on time? Do this:
- Compare the two end numbers.
- Check which line is rising or sliding at the right edge.
- Glance at the goal difference underneath.
- Tap the last two points to see who those games were against.
That is enough to know whether a team's recent results are a trend or a blip.
Use it alongside the rest of the match view
Form Trend works best as a check on the other cards:
- Form agrees with the model. The predicted winner is also on the rising line. Two separate signals point the same way.
- Form disagrees. The model favours a team that has lost three of its last four. Look closer before trusting either. Check the goals table and who those recent games were against.
- Both lines are flat or see-sawing. Treat the match as harder to call, whatever the headline numbers say.
Common mistakes
- Reading only the end number. The slope is where the story is.
- Ignoring who the opponents were. Tap the points. Beating a top side and beating a struggling one both move the line up one step.
- Treating one result as a trend. A single loss doesn't turn a rising line into a sliding one. Look for a run.
- Over-trusting a see-saw. If the line has no direction, the form isn't telling you much.
What it does not do
Form Trend is for display only. It does not feed into any ScoreSync prediction, confidence rating or ranking.
It also counts every result the same. A win over a top side and a win over a struggling one are each one step up, and cup and league games count alike. Use it as context, not as a forecast.
Quick answers
How many matches does it use? The last ten for each team, across every competition.
Does it change the model's prediction? No. It is there to help you read the match, nothing more.
Why does a draw keep the line flat? Because it is neither a gain nor a loss. The line only moves when a team wins or loses.
Where to find it
Open any match and scroll to the Form Trend card. On wider screens, the goals and table summary sit beside the chart instead of below it.
Next time you open a match, check the shape before the number. It takes a few seconds, and it often tells you more.