 ScoreSync News
Open App
ScoreSync News
Open App
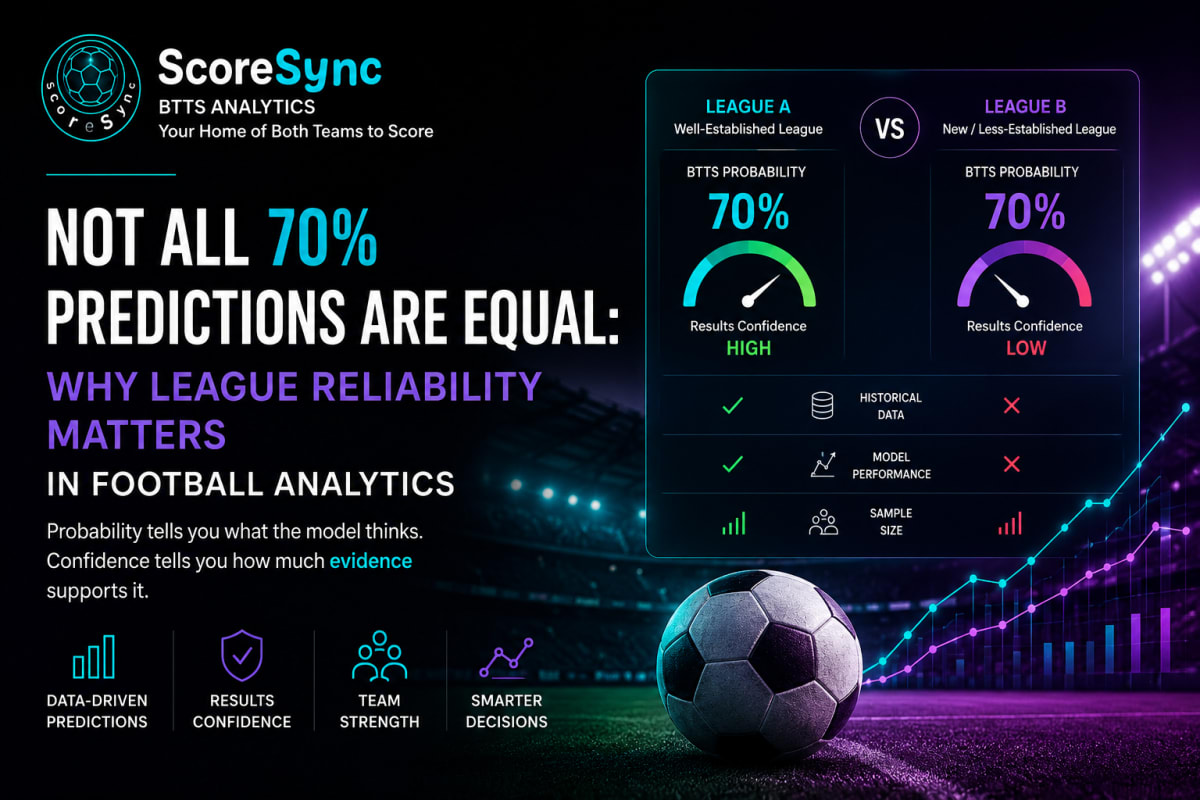
A 70% prediction looks precise. But without context, it can be misleading.
Two football matches can both carry a 70% probability for the same outcome while having very different levels of evidence behind them.
That distinction sits at the heart of a more useful approach to football analytics: probability tells us what the model expects; confidence helps us understand how much evidence supports that expectation.
Two Matches. Same 70%. Different Story.
Imagine two football matches:
Match A — BTTS Yes: 70%
Match B — BTTS Yes: 70%
At first glance, they appear identical.
But suppose Match A comes from a competition where the model has accumulated a substantial history of settled predictions and has repeatedly demonstrated that its stronger signals translate well into actual results.
Match B comes from a newly covered competition with limited historical evidence, a smaller sample of settled predictions, or greater uncertainty around the model's performance.
The percentages may both say 70%.
The evidence behind those percentages is not necessarily equal.
That is why looking at probability alone can leave out an important part of the picture.
Probability and Confidence Answer Different Questions
A common mistake in football analytics is treating probability and confidence as though they mean the same thing.
They don't.
Probability
A BTTS probability attempts to answer:
How likely is it that both teams will score in this particular match?
The model may arrive at that estimate using information about the two teams, their attacking and defensive characteristics, recent performances, expected scoring environment and other match-level signals.
Confidence
Confidence asks a different question:
How much supporting evidence do we have for trusting that assessment?
A model can calculate a 70% probability even when the historical evidence surrounding that prediction is still developing.
That does not automatically make the prediction wrong.
It means the level of certainty we attach to it should reflect the evidence available.
Football Leagues Are Different Environments
Football follows the same basic rules around the world, but competitions do not behave identically.
Some leagues consistently produce more goals.
Others are more defensive.
Some competitions contain relatively evenly matched teams, while others have substantial differences between the strongest and weakest clubs.
League environments can also differ because of:
- Competitive balance
- Tactical styles
- Promotion and relegation
- Squad depth
- Schedule structure
- Home advantage
- Data availability
- Number of historical matches
- Seasonal changes in participating teams
Even the same league can change over time.
Promoted and relegated clubs alter the competitive landscape. Managers change. Squads are rebuilt. Tactical trends evolve.
A football model therefore should not simply learn:
70% = strong
and apply that interpretation universally.
A more useful question is:
When the model has produced predictions like this in this environment, how well have those predictions actually performed?
That is where league reliability becomes important.
The Difference Between a Prediction and a Track Record
Suppose ScoreSync analyses two competitions.
In League A, the system has generated and settled hundreds of predictions. Across that history, stronger model signals have generally translated into stronger results.
In League B, only a relatively small number of predictions have settled.
Now imagine a fixture from each league receives exactly the same BTTS probability:
League A
BTTS Yes: 70%
League B
BTTS Yes: 70%
The match-level model may genuinely identify similar BTTS potential in both fixtures.
But the historical evidence surrounding those predictions is different.
League A has a deeper track record.
League B is still building one.
This means the model can distinguish between:
What it predicts
and
How much evidence currently supports trusting predictions in that environment.
Why Sample Size Matters
Consider a newly covered competition where the model has made four settled predictions.
All four were correct.
That produces a 100% success rate.
It sounds impressive.
But four matches are not enough to establish that the model will maintain anything close to 100% performance.
Short sequences can be heavily influenced by variance.
Now compare that with another competition where the model has accumulated hundreds of settled observations and maintained relatively stable performance across a much larger sample.
Those two records should not be treated as equally informative simply because the smaller sample happens to display the larger percentage.
This is a fundamental statistical principle:
The amount of evidence behind a result matters.
As more matches settle, the model gains more information about whether an observed pattern is persistent or simply short-term noise.
For ScoreSync, historical performance is therefore evidence that develops over time.
Why a Universal BTTS Threshold Isn't Enough
Imagine a football prediction platform using one simple rule:
Every match above 70% BTTS probability is a strong prediction.
It is easy to understand.
But simplicity does not necessarily mean intelligence.
Suppose predictions between 65% and 70% have historically performed extremely well in one competition.
In another league, predictions within the same probability range may have produced much less consistent results.
Why should those two environments automatically receive exactly the same interpretation?
They shouldn't necessarily.
This is why ScoreSync's approach focuses on calibration rather than magic numbers.
The objective is not to discover one percentage that works everywhere forever.
The objective is to understand what different probability levels mean when they are repeatedly tested against real football results.
Results Confidence Adds Context to the Prediction
This principle is reflected in ScoreSync's Results Confidence signal.
Rather than looking only at today's BTTS probability, Results Confidence introduces another layer of historical context.
In simplified form:
BTTS Probability
+
Historical evidence from settled predictions
=
A more informed interpretation of the signal
This creates an important distinction.
A fixture can have a high BTTS probability but weaker Results Confidence.
Another fixture can have a similar BTTS probability and stronger Results Confidence.
The probability tells you what the model thinks about the match.
Results Confidence helps indicate how much historical evidence exists around the model's performance.
Neither is a guarantee.
Together, however, they provide considerably more information than a headline percentage alone.
What Two 70% Predictions Might Actually Look Like
Here is a simplified example:
| Measure | Match A | Match B |
| --- | --- | --- |
| BTTS probability | 70% | 70% |
| League history | Extensive | Limited |
| Historical model evidence | Stronger | Still developing |
| Results Confidence | Higher | Lower |
| Interpretation | 70% with stronger supporting evidence | 70% with greater uncertainty |
The underlying probabilities have not changed.
Both remain 70%.
What changes is our understanding of the evidence surrounding them.
That distinction matters because uncertainty should not be hidden from users.
If the available data does not yet justify strong confidence, a responsible analytics system should communicate that rather than manufacture certainty.
A Higher Probability Is Not Automatically the Stronger Overall Signal
Consider another example:
Fixture A
BTTS Yes: 74%
Results Confidence: Lower
Fixture B
BTTS Yes: 68%
Results Confidence: Higher
Which fixture provides the stronger overall signal?
The answer cannot be determined simply by choosing the larger probability.
Fixture A has the stronger match-level BTTS estimate.
Fixture B has stronger historical support surrounding the model's assessment.
They tell us different things.
This is precisely why ranking every football match purely from highest probability to lowest can oversimplify the analysis.
ScoreSync keeps these concepts visible rather than collapsing everything into one unexplained number.
Team Strength Adds Another Layer
League reliability is not the only context that matters.
Two teams can display similar recent BTTS characteristics while being dramatically different in underlying quality.
ScoreSync therefore also considers team strength alongside match probabilities and historical results.
That introduces another useful question:
Does the prediction make sense when viewed alongside the relative quality and performance of the teams involved?
Team-strength analysis can consider signals related to attacking capability, defensive performance, form and the competitive context surrounding the fixture.
This is why ScoreSync also provides Team Strength & Results Confidence as a way of exploring matches.
It brings together two distinct ideas:
Team Strength — What does the underlying quality of the teams tell us?
Results Confidence — How much historical evidence supports the model's performance?
A probability becomes more informative when users can see the context surrounding it.
Reliability Is Not the Same as League Quality
There is another important distinction.
League reliability does not simply mean ranking which countries or competitions have the best football.
A lower-tier competition can still provide useful and consistent analytical evidence.
A prestigious top-flight competition can still contain periods of uncertainty.
The relevant question is not:
How famous is this league?
The more useful question is:
How much reliable evidence does the model currently have here?
Popularity, football quality and predictive reliability are different concepts.
That is also why ScoreSync can treat Popular sorting separately from confidence-based sorting.
One helps users find familiar competitions.
The other helps users investigate analytical evidence.
They serve different purposes.
New Leagues Should Earn Confidence
This becomes especially important as ScoreSync expands its competition coverage.
When a new league enters the system, the model may immediately be capable of analysing its fixtures.
But there is a difference between being able to generate a prediction and having enough settled history to make strong claims about the model's demonstrated reliability in that competition.
The sensible process is gradual:
- Predictions are generated.
- Matches are played.
- Results settle.
- Historical performance grows.
- The system gains more evidence.
- Confidence becomes better informed.
In other words:
Confidence should be earned by data.
This principle also protects against one of the easiest mistakes in analytics: becoming overly impressed by small samples.
A competition performing extremely well across a handful of predictions should not automatically be considered more reliable than one that has demonstrated stable performance across a much larger body of evidence.
Context matters.
Every Finished Match Should Teach the Model Something
There is a broader philosophy behind this approach.
Prediction systems should not simply produce forecasts.
They should also be designed to evaluate themselves.
Every completed football match provides new information.
Did the predicted event occur?
Did stronger predictions outperform weaker ones?
How did predictions within similar probability ranges perform?
Is the league behaving as expected?
Has historical performance improved or deteriorated?
Does the evidence suggest that previous assumptions need recalibration?
These questions transform settled matches from historical records into feedback.
And feedback is what allows an analytics system to become better informed over time.
A model that never compares its predictions with reality can remain confidently wrong.
A system that continually evaluates performance can identify when its assumptions deserve reconsideration.
Calibration Matters More Than Impressive Percentages
People naturally gravitate toward large numbers.
82% looks more attractive than 67%.
90% appears stronger than 72%.
But probability models should ultimately be judged by calibration, not by how impressive their percentages look.
Imagine a model repeatedly identifies events as approximately 70% likely.
Across a sufficiently large and representative sample, we would expect outcomes in that probability region to occur at a broadly corresponding rate if the model is well calibrated.
If its 70% predictions succeed dramatically less often, the model may be overconfident.
If they succeed substantially more often, the model may be underconfident.
Either result provides useful information.
The objective is therefore not to generate the biggest possible percentages.
It is to generate probabilities whose relationship with reality can be measured, challenged and improved.
That is a much higher standard.
From Prediction Engine to Football Intelligence
This is why ScoreSync is designed around more than a single prediction percentage.
A BTTS probability is useful.
But football intelligence becomes more meaningful when that probability can be considered alongside additional signals.
BTTS Confidence
How strongly does the model support the BTTS assessment?
Results Confidence
How much historical performance evidence supports the signal?
Team Strength
What does the underlying quality of the two teams tell us?
Competition Context
What kind of football environment is producing the prediction?
Settled Results
What actually happened after previous predictions were made?
Together, these signals provide a richer picture than probability alone.
The objective is not to make football appear certain.
Football isn't certain.
The objective is to make uncertainty more measurable, transparent and useful.
The Takeaway
When two matches both display 70% BTTS Yes, it is tempting to assume they are equivalent.
They aren't necessarily.
One prediction may be supported by substantial historical evidence in a competition where the model has established a meaningful track record.
Another may come from a league where evidence is still accumulating.
The probability percentage is therefore only one part of the story.
The better questions are:
- How was that probability produced?
- How much evidence supports it?
- How reliable has the model been in this environment?
- How large is the sample behind that conclusion?
- Does the underlying team-strength picture support the prediction?
That is the difference between simply displaying predictions and building football analytics around evidence.
At ScoreSync, 70% is not treated as the end of the analysis.
It's where the next question begins.
Explore the Data Behind the Prediction
ScoreSync brings together BTTS probabilities, confidence signals, team-strength analysis, league-level performance and settled results to provide more context behind football predictions.
Don't just ask:
What is the probability?
Ask:
How much evidence stands behind it?
Football predictions are probabilistic and cannot guarantee future results. ScoreSync analytics are provided for informational purposes and should be interpreted alongside the uncertainty inherent in football.